
By Prof Hal Pawson.
Official figures released this week reveal that Australia’s social housing stock actually declined in 2019-20. The combined total of public housing, community housing, state owned and managed Indigenous housing and Indigenous community housing dwellings, dropped from 429,316 to 428,497 over the year (see notes to Figure 1).
These statistics come from the annual Report on Government Services, as published by the Productivity Commission in January each year. Social housing stock changes over time reflect the net impact of new construction, sales and demolitions. But because – problematically – none of these components of change are officially logged or published we can’t know for sure how each contributes to the overall outcome. All we can definitely say about the recent stock decline is that it shows sales and demolitions exceeded new construction over the past year. It’s likely that all of these numbers were fairly small.
Looking back over the past decade, and comparing annual change in social housing stock with yearly population change, it’s clear that the former has been lagging far behind the latter. Nationally, in only two years has social housing expanded by more than 0.5%, whereas in all years bar one (up to and including 2018-19), population rose by 1.5% or more – see Figure 1. Taking the period 2011-2020 as a whole, Australia’s social housing stock grew by only a sickly 2% compared with general national population growth of 15%.
Another way of putting this is to say that, collectively, Australian governments have been woefully failing to grow social housing to keep pace with growing need (assuming that such need has remained at a steady per capita level – a possible understatement). The statistical result of this divergence will have been continuation in the decline of social housing as a proportion of overall national dwelling stock. During the 2020s it will likely fall below 4%.
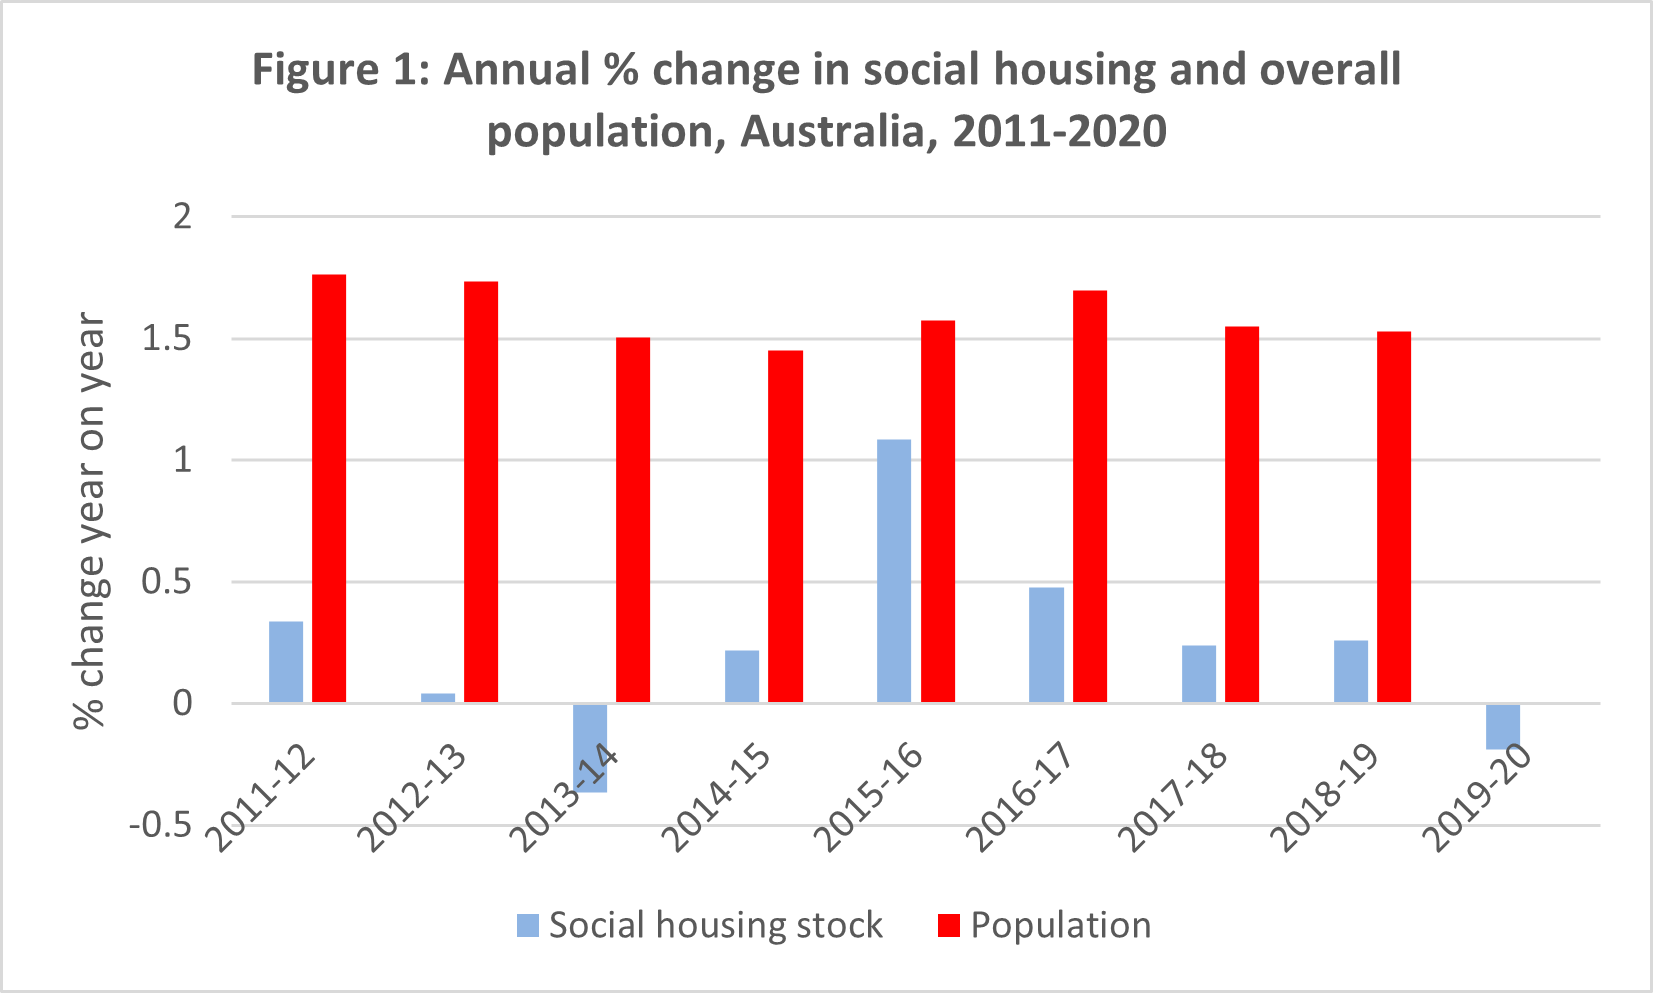
Sources: 1. Social housing stock – Productivity Commission; Report on Government Services 2021; Table 18A3. Population – ABS Cat 3101.0 Australian Demographic Statistics Table 4: Estimated Resident Population. Notes: 1. Indigenous community housing stock in 2019-20 assumed to be the same as 2018-19; 2. Historically missing Indigenous housing statistics for Northern Territory patched in on the assumption that these were the same as published for the next succeeding year. 3. Community housing statistics included on the basis of ‘dwellings’ rather than ‘tenancies’. 4. See other qualifications of the statistics as noted by the Productivity Commission in the original table.
As shown in Figure 2, in only one jurisdiction – Tasmania – did the state/territory government manage to grow social housing sufficiently to keep pace with population over this period. Even in NSW, where social housing has been expanded most notably over the period (from 143,520 to 154,530), this has fallen substantially short of overall population increase (8% compared with 13% – see Figure 2). It should also be mentioned that a change over time comparison that spans 2016 tends to flatter NSW because from that date (says the Productivity Commission) the state’s ‘community housing’ stock figures included NRAS-funded properties whereas, by implication, such dwellings have remained excluded for other jurisdictions.
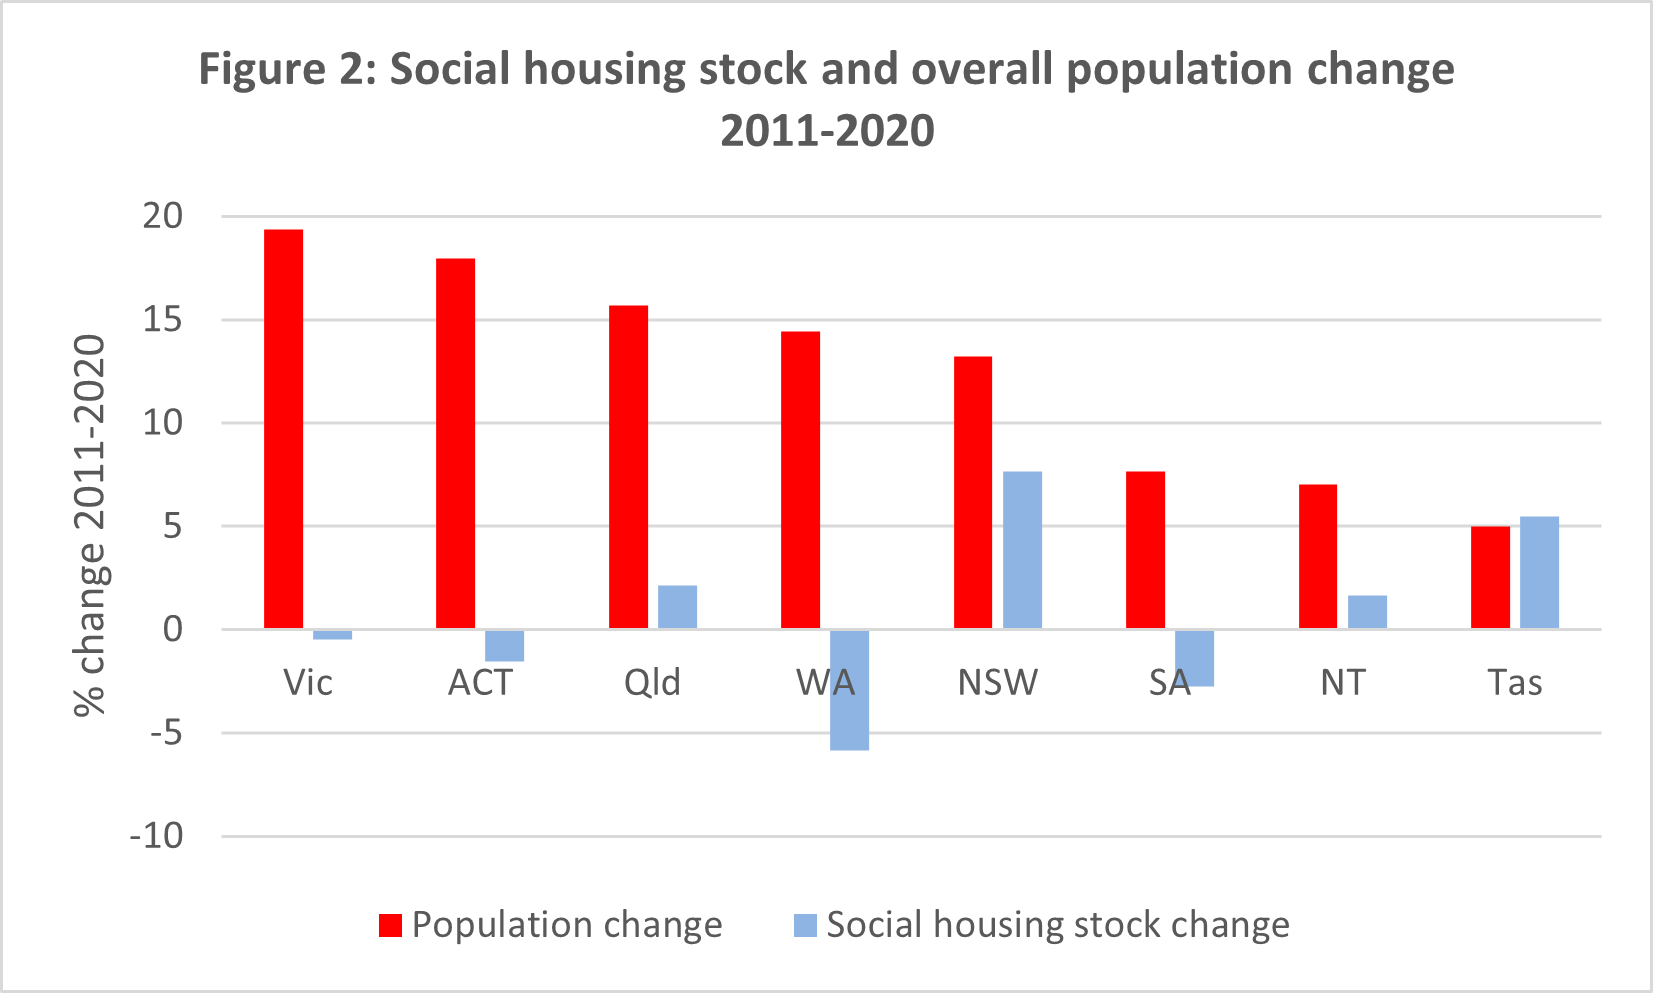
Sources: As Figure 1. Notes: As Figure 1 – plus population change based on the period June 2010-June 2019 – statistics for June 2020 not yet published.
Open market sales of public housing constitute one factor explaining the failure to adequately grow social housing provision in most jurisdictions. For example, as recently revealed in The Australian (paywall), the NSW Government sold nearly 4,000 public housing properties in the period 2011-2020. However, even if these had all been retained in state ownership, the state’s provision would have still failed to keep pace with population. In most – or possibly all – jurisdictions, relative decline of social housing is probably mainly the result of inadequate construction, not property disposal.
Capital expenditure on social housing is falling
Related to this story, capital expenditure on social housing (ROGS Table 18A1) has been falling across Australia over the past two years (by 4% over 1 year, by 5% over 2 years). The biggest reduction seen over this time has been in NSW (down 25%) – possibly resulting from the exhaustion of capital receipts from the sale of valuable properties at Millers Point.
(Officially enumerated) demand for social housing is growing
On the demand side, public housing waiting lists have shown recent growth (ROGS Table 18A5). Nationally, the total increased by 4% in 2020 to 155,141 (up by 5% since 2016). Perhaps more significantly, the number of new ‘greatest need’ waiting list applicants has been rising rapidly across the country – up by 11% in 2020, and by 54% over the four years since 2016 (from 37,897 to 58,511). Over the past year particularly marked increases have been recorded in Queensland (26%) and WA (18%).
Taking stock of the demand/supply picture
To the extent that the ROGS statistics provide a reliable basis for judgement (while flawed, they also represent the best evidence that exists), it’s probably appropriate to highlight the Tasmanian Government’s achievement through the 2010s in growing social housing sufficiently to maintain its representation within the state’s overall housing stock (a net increase of over 700 dwellings). Also, of course, Victoria has to be singled out for its recognition of the need to ‘stop the rot’ signalled by its recent ‘Big Housing Build’ announcement.
But over the past decade all of Australia’s other governments – most glaringly, The Commonwealth – have turned a blind eye to the vital need to (at the very least) maintain the provision of social housing in ‘real terms’. And, while acknowledging the small-scale new build initiatives announced by several state/territory governments over the past year or two, all (with the exception of Victoria) very largely continue to do so.
No Comments so far ↓
There are no comments yet...Kick things off by filling out the form below.